Tiara's Amazing Maps
Friday, October 29, 2010
Star Plot
A star plot allows you to show the value of different variables and then compare their relationship. This star plot shows the different design possibilities of robots for NASA. As we see in the star plot, all the robots were very strong in some areas but performed low in others.
http://start1.jpl.nasa.gov/caseStudies/autoTool.cfm
Similarity Matrix
A similarity matrix shows the similarity between different variables. This similarity matrix shows the relationship of longevity genes and diet, gender, etc. in mice.
http://www.biomedcentral.com/1471-2164/8/353/figure/F5?highres=y
Box Plot
A box plot is a suitable way of depicting certain groups of numerical data into a five number summary. This is a box plot of the annual snow depth at Mathsville Ski resort.
http://edubuzz.org/blogs/nbhs3x1/2007/01/08/8-jan-2007-five-figure-summary-and-box-plots/
Triangular Plot
A Triangular plot is usually a graph of 3 variables, which is sometimes used in geologic studies to show the comparative compositions of like rocks and soils. They also can be used and applied to any kind of system using three variables. This is a diagram of the Hmax off Kauai for various slip allocations between three Aleutian Sources.
http://www.pmel.noaa.gov/maillists/tmap/ferret_users/fu_2007/msg00384.html
Wednesday, October 27, 2010
Bilateral Graph
A bilateral graph is usually a graph that displays two variables.It often shows an increase on one side of a zero line and a decrease on the other. On this bilateral graph it’s showing the trade balance of different countries and its deficit change.
http://mpettis.com/2009/08/yet-another-discussion-on-the-asian-savings-glut-hypothesis-and-why-it-matters
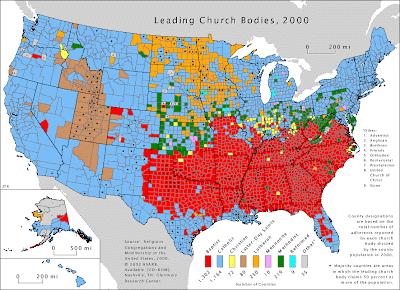
Nominal Area Choropleth Map

The Nominal area choropleth map is a map that displays nominal data. This choropleth map is a map of the United States, and the distributions of the different religions around the nation, in different states.
http://www.sixsteps.org/2006/04/
Unstandardized Choropleth Map
Unstandardized Choropleth maps are maps that demonstrate information without averaging the data, in no sort of way using raw numbers. This detailed map shows the population in Europe.
http://support.sas.com/documentation/cdl/en/graphref/63022/HTML/default/viewer.htm#overview-gmap.htm
Subscribe to:
Comments (Atom)


